
By Tom Walski
The Run for the Diamonds in Berwick, PA is one of the oldest running events in the country. While these days, the race has over a thousand runners of all sorts of abilities, for most of its history, it was a race for elite runners, with only a handful of participants, all male.
In its early years, it brought together Olympic Champions and world record holders. If those runners returned today, they might recognize Berwick, but they might not recognize the event, which has become a peoples’ race.
The Berwick Marathon Association’s website, https://www.runfordiamonds.com/, and Mark Will-Weber’s book, Run for the Diamonds, contain a wealth of information about the history of the event. This article takes results from the BMA’s website and looks at the trends in the race’s evolution.
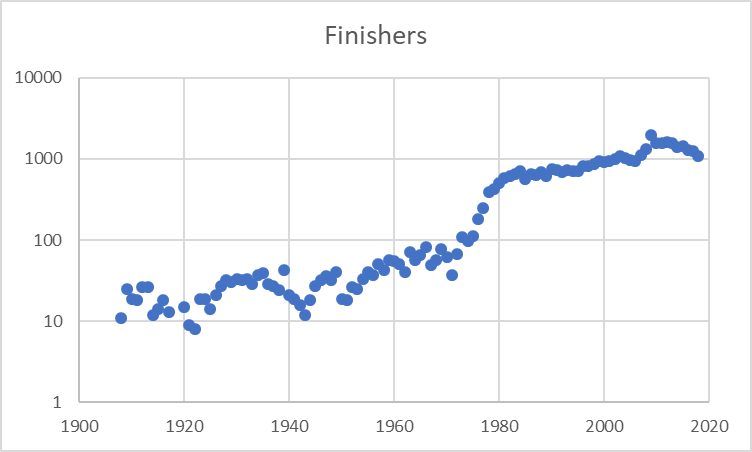
First, look at number of finishers in the race. Up until about 1970, the number of finishers was in the single or double digits. The upward trend finally broke through the 100-barrier in 1973 as the growth became exponential. The number of finishers has fallen off since the 100th anniversary race but are still impressive.
A better way to look at the number of finishers would be to use a logarithmic scale which demonstrates the exponential growth the race has experienced.
While the quantity of the race has grown, what has happened to the quality? That’s best demonstrated by showing the winning times which have remained relatively flat with Pete Pfitzinger’s 1980 course record not being seriously threatened in recent years. In fact, the winners seem to be getting slower.

The times of the last runner also say something about the nature of the event. In the early days, only the winning times mattered. If a runner didn’t break 55 minutes, why did they even bother showing up and why should the officials time them? If someone couldn’t run sub-6:00 miles for nine hilly miles, they weren’t really runners. The last place times today show the tolerance of race officials for even the slowest runners. (A few very slow times were eliminated from the graph below).

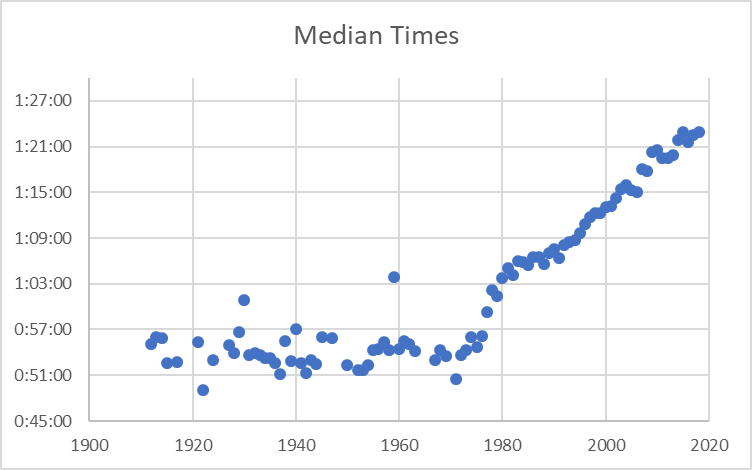
Possibly the best indicator of the popularity of the event might be the median time (the time of the middle finisher). The typical Berwick finisher has gotten slower and slower over time partly due to the addition of age-group categories and the influx of women. But most runners go home without awards, so it’s not just age groups than account for slower times. The thrill of victory has been replaced by the thrill of finishing the challenging course. In any case, it’s still rewarding.
Categories: Features
